Extracting and Manipulating Data
from a CSV file in Python
Click the button below to download the CSV file to view the original Pokemon Database data:
Click the buttons below to view the output files for this project. The first file is a filtered list of the Top 20 Pokemon with the highest base stat totals. The second file is the average base stat total of the Top 20 Pokemon by Generation:

Why undertake this project?
One of the challenges I set for myself in 2023 was to begin learning a programming language. After some research, I decided that Python would be the most suitable language for me to learn, as it is widely regarded as a beginner-friendly language and would be useful in my career as a Data Analyst.
After spending some time learning the basics of Python, I wanted to put my newly developed skills to the test, whilst also utilising some of my fundamental skills as a Data Analyst.
In this project, I will demonstrate how to read and write CSV files using Python and also perform simple data extraction and manipulation tasks. For clarification, all code was written in Visual Studio Code and I was using Python version 3.10.9 from the Anaconda Distribution package.
The Task
Firstly, I needed a dataset to work with. As this was my first project using Python, I wanted the subject to be something fun and light-hearted. Fortunately, I had been compiling a dataset myself based on a childhood hobby of mine, Pokemon. For those of you not aware of what Pokemon is, Pokemon is a franchise originally stemming from a videogame released in 1995-96. Since then, the franchise has exploded into other mediums such as anime, manga, toys, trading cards, etc., the list is endless... However, what most people don't realise is that the Pokemon videogames are FILLED with mathematics and data! For the purposes of this project, all you need to understand is that each Pokemon has their own individual overall numbered stats called "base stat totals" or BST for short. Generally, the higher the BST the "stronger" the Pokemon. I won't be delving into stats further than what has already been mentioned in this project however, I will be exploring this in detail in future projects.
Now that I have the dataset I want to work with, lets look at working with the data in Python. I have included the full code in the pictures below:

In order to understand what this script is doing, lets break it down into steps. I have also included line references in the steps to identify where in the script we are looking:
- Import necessary libraries (lines 1-3)
- Load Pokémon data from a CSV file into a DataFrame (line 7)
- Create a filtered DataFrame without Mega Pokémon (line 11)
- Create sub-tables based on Pokémon generations (lines 15-22)
- Create DataFrames for Pokémon with a status of "Normal" (lines 26-33)
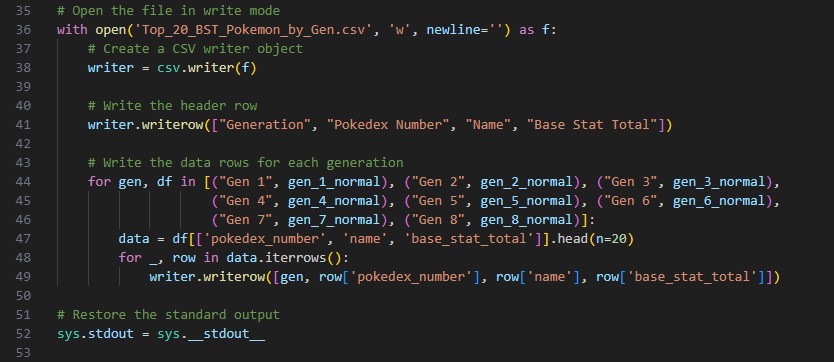
- Open a CSV file for writing the top 20 Pokémon by base stats for each generation (line 36)
- Write header and data rows to the CSV file (line 38-49)
- Restore the standard output (line 52)
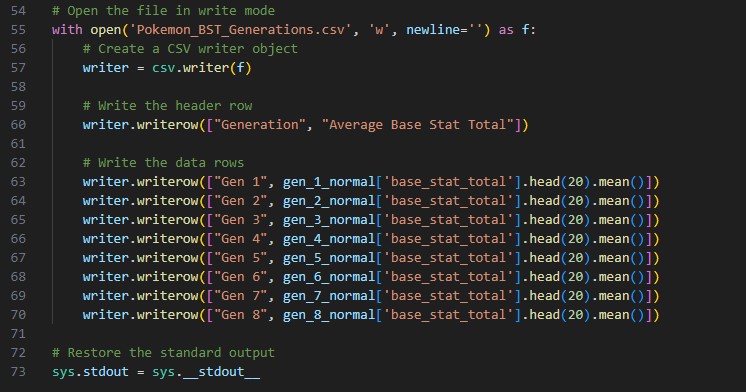
- Open a CSV file for writing the average base stat totals for each generation (line 55)
- Write header and data rows to the second CSV file (line 57-70)
- Restore the standard output again (line 73)
The Steps Breakdown
Step 1 - Import necessary libraries (lines 1-3):
- 'pandas' is imported as 'pd' for data manipulation.
- 'sys' is imported to work with system-specific parameters and functions.
- 'csv' is imported to read and write CSV files.
Step 2 - Load Pokémon data from a CSV file into a DataFrame (line 7):
- It reads a CSV file named 'Pokemon Database.csv' located at the specified path into a Pandas DataFrame named 'df'.
Step 3 - Create a filtered DataFrame without Mega Pokémon (line 11):
- A new DataFrame 'df_no_mega' is created by filtering out rows where the 'mega' column is not equal to True (essentially excluding Mega Pokémon).
- The filtered DataFrame is then sorted by the 'base_stat_total' column in descending order, which sorts the Pokémon by their base stats.
Step 4 - Create sub-tables based on Pokémon generations (lines 15-22):
- Separate DataFrames are created for each Pokémon generation (Gen 1 to Gen 8) by filtering rows based on the 'generation' column.
Step 5 - Create DataFrames for Pokémon with a status of "Normal" (lines 26-33):
- For each generation, a new DataFrame is created that further filters the Pokémon by their 'status' column, specifically selecting those with a status of "Normal."
Step 6 - Open a CSV file for writing the top 20 Pokémon by base stats for each generation (line 36):
- The script opens a CSV file named 'Top_20_BST_Pokemon_by_Gen.csv' in write mode, ready to write data.
Step 7 - Write header and data rows to the CSV file (line 38-49):
- For each generation, the script extracts the top 20 Pokémon from the 'gen_X_normal' DataFrames (X represents the generation number) and writes their 'pokedex_number,' 'name,' and 'base_stat_total' to the CSV file.
Step 8 - Restore the standard output (line 52):
- After writing data to the first CSV file, the standard output is restored to its default value, which is usually the console.
Step 9 - Open a CSV file for writing the average base stat totals for each generation (line 55):
- The script opens another CSV file named 'Pokemon_BST_Generations.csv' in write mode.
Step 10 - Write header and data rows to the second CSV file (line 57-70):
- For each generation, the script calculates the average base stat total for the top 20 Pokémon and writes it to the CSV file.
Step 11 - Restore the standard output again (line 73):
- Finally, the standard output is restored again to its default value.
In the breakdown above, I have highlighted the component parts of the script and identified what each component is doing when run. If you are trying to replicate this script at home, please be aware that on line 7, where "filepath" is specified, you will need to replace this with the actual file path of where you have saved the Pokemon Database.csv document.
Conclusion
In this project, I have demonstrated some of the skills I have learnt using the Python programming language. I have also demonstrated how to extract and manipulate data from a datasource.
In future projects, I will be looking to demonstrate further Python skills, as well as utilising other skills of a Data Analyst such as, analysing and visualising data.
I hope you all enjoyed reading this project as much as I enjoyed making it! Please feel free to have a go yourself. If anyone has any questions regarding this project, you can reach out to me on LinkedIn using the links provided at the top of this page.
Thank you all for reading!